epcadmin

Bulls, Bears, & Long-Term Benefits of Stock Investing

Investment graph

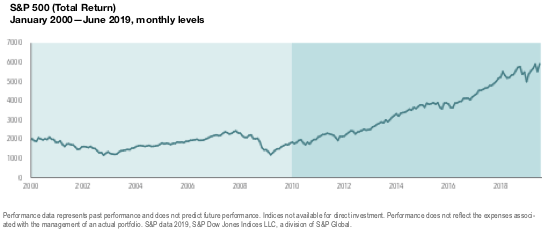
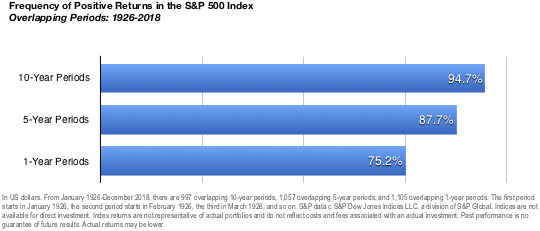
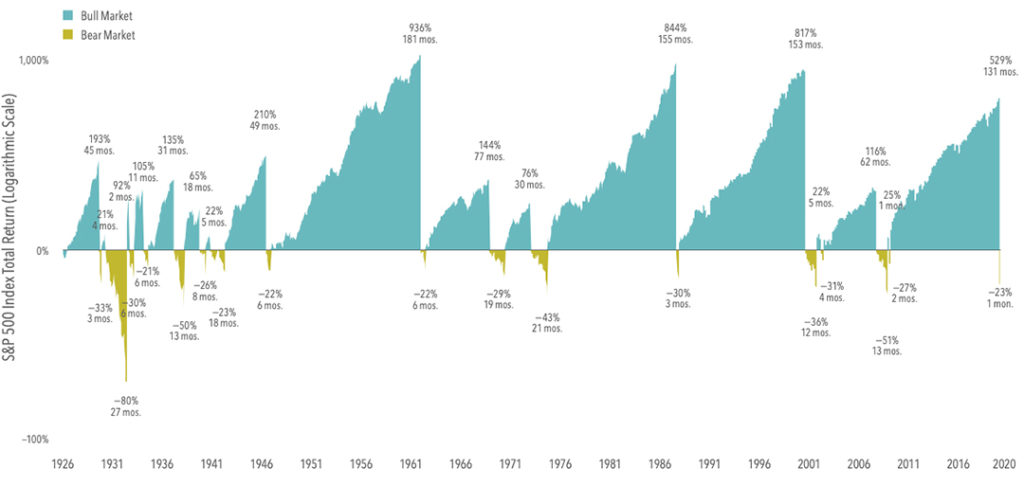
Riding the Bull History suggests that markets hitting new highs, or experiencing declines, provides little evidence of future returns. Looking at the S&P 500 Index from 1926-2018, we find that average annualized returns have been positive over one-, three-, and five-year periods following both new monthly highs and market declines of at least 10%. In …

Bulls, Bears, & Long-Term Benefits of Stock Investing Read Full Article »

Do Mutual Funds Outperform Benchmarks?

Dimensional’s 2020 analysis of US-based mutual funds shows that only a small percentage of funds have outperformed industry benchmarks after costs—and among top-ranked funds based on past results, only a small percentage have repeated their past success.

An Age Old Debate in Finance: Active vs. Passive

Active vs passive graph

Don’t Try to Outguess the Market The competitive landscape makes the search for future winners a formidable challenge. Confronted with so many fund choices—and lacking an investment philosophy to inform their search—some investors will resort to using track records as a guide to selecting funds, reasoning that a fund manager’s past outperformance is likely to …

An Age Old Debate in Finance: Active vs. Passive Read Full Article »

Value Judgements: Viewing the Premium’s Performance Through History’s Lens

performance of US value and US growth stocks

Investing in an Uncertain World There’s a misconception in the markets: value stocks have lost their vigor. Value stocks have underperformed growth stocks over the past decade. In the US, the annualized compound return has been 12.9% for value stocks, or those trading at a low price relative to their book value. That contrasts with …

Value Judgements: Viewing the Premium’s Performance Through History’s Lens Read Full Article »

The Uncommon Average

Frequency of Positive Returns in the S&P 500 index

The US stock market has delivered an average annual return of around 10% since 1926. But short-term results may vary, and in any given period stock returns can be positive, negative, or flat. When setting expectations, it’s helpful to know the range of outcomes experienced by investors historically. For example, how often have the stock …

The Uncommon Average Read Full Article »