Riding the Bull
History suggests that markets hitting new highs, or experiencing declines, provides little evidence of future returns. Looking at the S&P 500 Index from 1926-2018, we find that average annualized returns have been positive over one-, three-, and five-year periods following both new monthly highs and market declines of at least 10%.
In addition, the one-year and three year returns for the S&P 500 look similar after both market highs and declines of 10%. In this data, we also see that the average return following a new market high is close to the average return after all other months, not just declines of 10%.
Stock returns are volatile, but nearly a century of bull and bear markets shows that the good times have outshined the bad times.
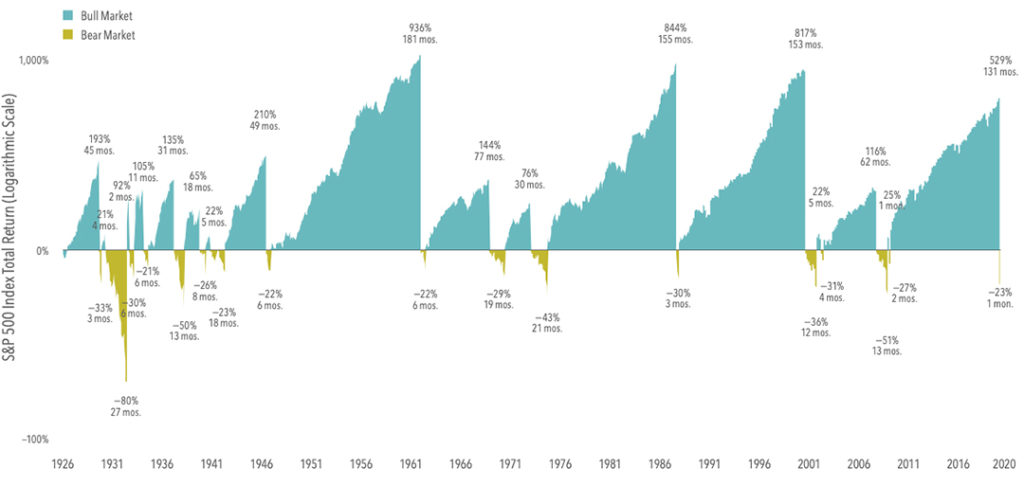
Troughs to Peaks
From 1926 through March 31, 2020, the S&P 500 Index experienced 17 bear markets, or a fall of at least 20% from a previous peak. The declines ranged from -21% to -80% across an average length of around 10 months.
On the upside, there were 17 bull markets, or gains of at least 20% from a previous trough. They averaged 56 months in length, and advances ranged from 21% to 936%.
When the bull and bear markets are viewed together, it’s clear equities have rewarded disciplined investors.
The stock market’s ups and downs are unpredictable, but history supports an expectation of positive returns over the long term. For the best shot at the benefits the market can offer, stay the course.