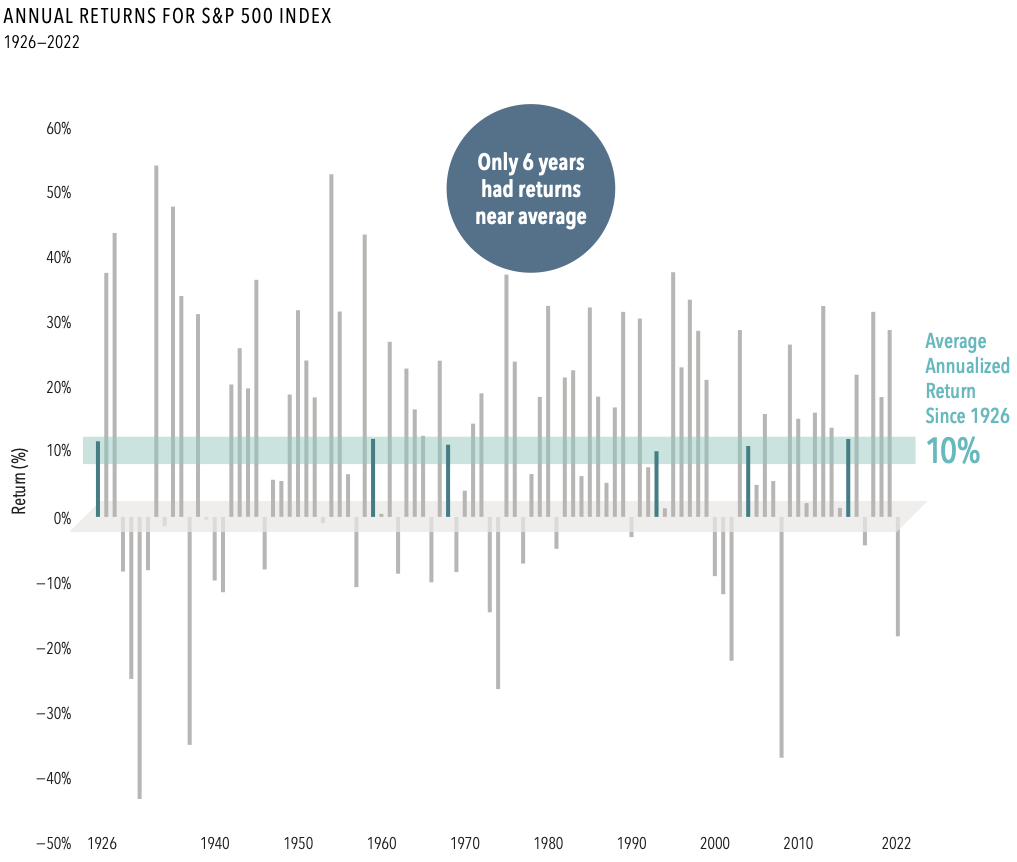
Since 1926, the US stock market has rewarded investors with an annualized return of about 10%. But returns in any given year may be sky-high, extremely poor, or somewhere in between.
- Annual returns came within two percentage points of the market’s long-term average in just six of the past 97 years.
- Yearly returns have ranged as high as up 54% and as low as down 43%.
- Since 1926, annual returns have been positive 71 times and negative 26 times.
Understanding the range of potential outcomes can help you stick with a plan and ride out the inevitable ups and downs.
Past performance is no guarantee of future results. Actual returns may be lower. Investing risks include loss of principal and fluctuating value. There is no guarantee an investment strategy will be successful. Indices are not available for direct investment. Index returns are not representative of actual portfolios and do not reflect costs and fees associated with an actual investment.
In US dollars. S&P data © 2023 S&P Dow Jones Indices LLC, a division of S&P Global. All rights reserved.
Dimensional Fund Advisors LP is an investment advisor registered with the Securities and Exchange Commission.
Investment products: Not FDIC Insured; Not Bank Guaranteed; May Lose Value
Dimensional Fund Advisors does not have any bank affiliates.