Wes Crill, PhD
Senior Investment Director and Vice President
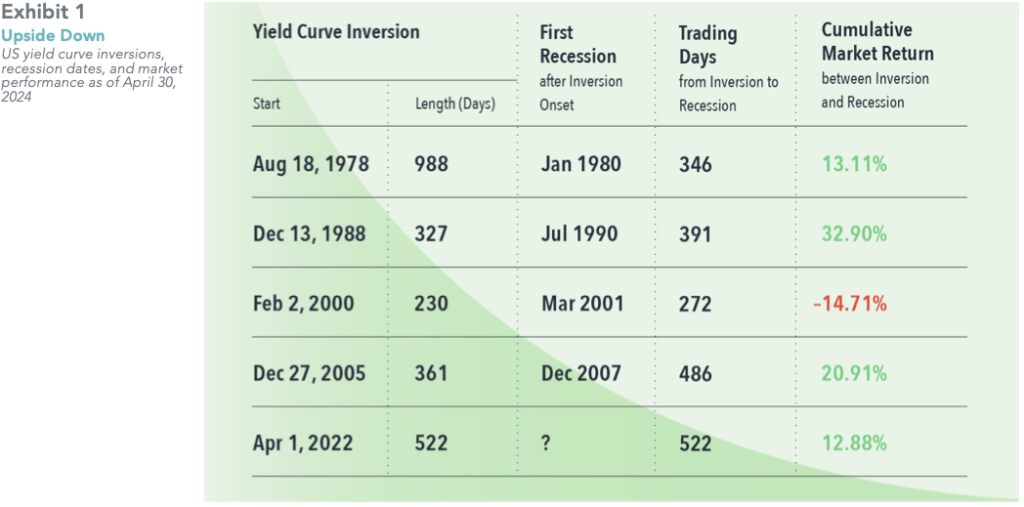
Since April 1, 2022, the yield on the 2-year US Treasury has exceeded that of the 10-year Treasury. This so-called inverted yield curve shape, where longer-dated bonds yield less than shorter-dated bonds, is considered by some as a harbinger of economic recession. While the previous four inversions were eventually followed by a recession, the inversion- recession link is questionable.
For starters, it took between 272 and 486 trading days from the inversion onset for the recession to arrive. That’s about one to two years. To put that in perspective, the average US economic expansion has been about five years, which means the average waiting time for a recession, regardless of the rate environment, has been about 2.5 years. And in three of the four cases, the inversion was over before the recession began.
We also had one recession without a yield curve inversion—that was in 2020, occurring under circumstances we can fairly characterize as unrelated to past bond yields.
So, an inversion doesn’t really narrow down the timetable to an economic downturn. There’s also not much evidence inversions are cause for concern with investments. The stock market has posted substantial gains between inversion and recession in three out of four past cases—and is up double digits so far during the current inversion.
One of my favorite quotes from Nobel laureate Robert Merton is: “Just because people are talking about something doesn’t make it important.” People are talking about the current inversion because it hit 522 trading days as of April 30, making it the longest inversion yet without a recession. History suggests that doesn’t make it important for investment decisions.
Past performance is not a guarantee of future results. Actual returns may be lower. Inversion when the yield on the 2-year Treasury exceeded the yield on the 10-year Treasury. Recession dates represent the peak month of the business cycle. Individual inversion onset defined as those lasting at least 50 trading days with no inversion in the prior 250 trading days. Number of days and return since onset of current inversion are through April 30, 2024. 10-year and 2-year constant maturity Treasury yields from FactSet. Business cycle dates from NBER. Market return represented by the Fama/French Total US Market Research Index. The Fama/French indices represent academic concepts that may be used in portfolio construction and are not available for direct investment or for use as a benchmark. Eugene Fama and Ken French are members of the Board of Directors of the general partner of, and provide consulting services to, Dimensional Fund Advisors LP. See “Index Descriptions” for descriptions of the Fama/French index data.