The US Value Premium—Year by Year
Value stocks have offered an average long-term return premium over growth stocks, which may reflect compensation for bearing higher systematic risk. However, short-term fluctuations in the value premium (relative to growth stocks) can be extreme.
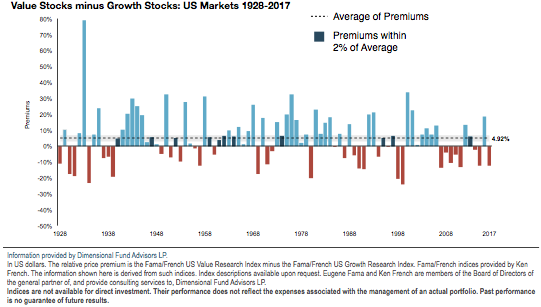
The light blue bars in the graph indicate the years in which the US value outperformed US growth. The red bars indicate when value underperformed growth. The dark blue bars indicate the years when a positive value premium was within a 2% range of its long-term average (4.92%).
The annual value premium varies widely and can experience extreme positive or negative performance swings relative to growth. The premium has been within 2% in only a few years since 1928. But it has been positive in a majority of years and has experienced a stronger upside than downside.
So, What Action Should Be Taken?
The superior performance of value stocks seems to persist in trends that last at least a few years. The same is true of growth stocks. There is no predictable pattern of how long these trends will last. But as the graphic shows, dramatic reversals can occur every few years, so it’s not a good idea to invest exclusively in value stocks, or only in growth stocks. Instead, the smart investor will own both stocks of value companies and the stocks of growth companies.
History shows that a healthy allocation to US value company stocks is a risk worth taking. Investors should take a longer-term view when targeting dimensions of higher expected returns and be prepared to stay disciplined throughout different market environments. Over longer periods, the dimensions show up much more frequently.