Nest Eggs in Different Baskets
It is difficult to predict future returns by looking at the past, as shown by the performance of global mar- kets since 2001.
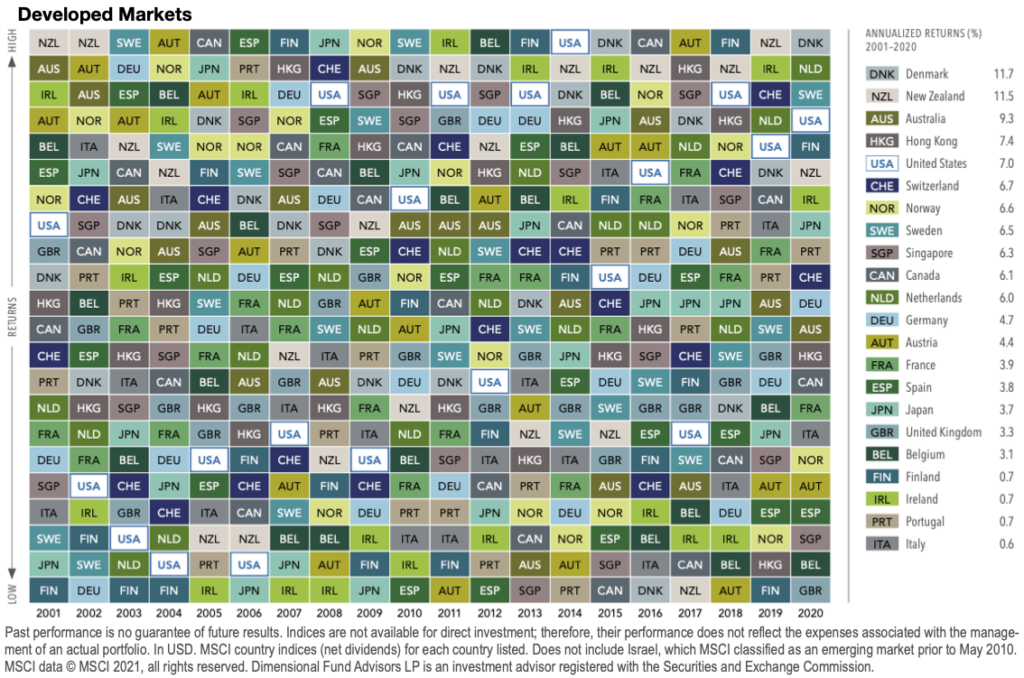
This table powerfully demonstrates the randomness of global equity returns. It illustrates 20 years of annu- al returns in 22 developed markets. Each color repre- sents a different country. Each column is sorted top down, from highest-performing country to the lowest.
The scattered colors suggest it is hard to predict which country will outperform from one year to the next. Austria, for example, posted the highest market return in 2017 but the lowest the next year.
Reading the Checkerboard
Investors holding equities from markets around the world can have a more consistent investment expe- rience, with higher returns in one market helping off- set lower returns elsewhere.
Because prices do such a good job incorporating information about securities in every market, they also offer the best prediction of future prospects. No sensible story or compelling empirical research sug- gests investors can consistently outguess those prices and pick winning countries. A well-diversified global portfolio can help capture the returns of markets around the world and deliver more reliable out- comes over time.