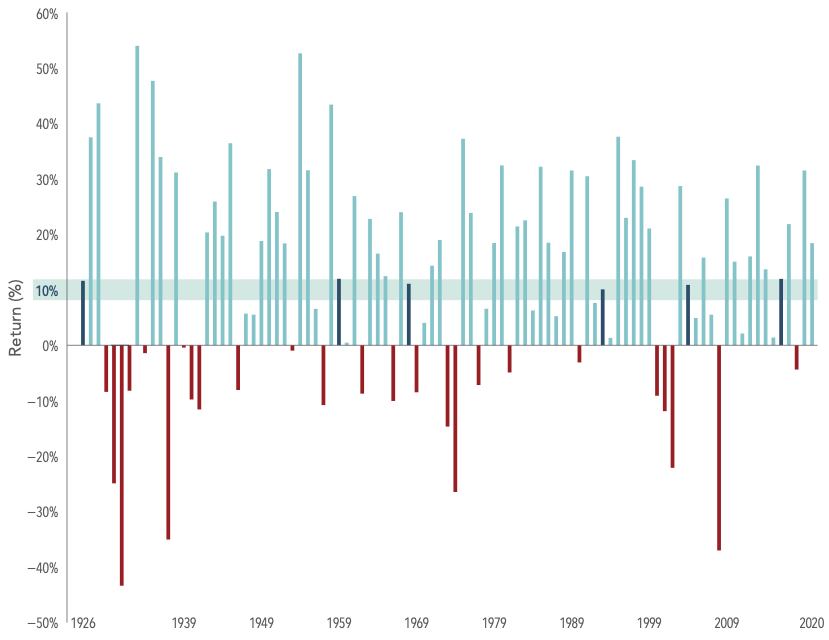
S&P 500 Index Annual Returns 1926-2020
Nowhere Near the Average
Stocks can reward investors who maintain a long- term outlook. But inconsistent short-term perfor- mance may test one’s commitment to a long-term strategy.
Since 1926, the US stock market has rewarded in- vestors with an average annual return of about 10%. But it’s important to remember that returns in any given year may be sky-high, extremely poor, or somewhere in between. The numbers to the right ex- emplify this.
• Annual returns came within two percentage points of the market’s long-term average of 10% in just six of the past 95 years.
• Yearly returns have ranged as high as up 54% and as low as down 43%.
• Since 1926, annual returns have been positive 70 times and negative 25 times.
Understanding the range of potential outcomes can help you stick with a plan and ride out the inevitable ups and downs.